 |
||
| Products | Services | User Log In | Contact Us | Company |
|
|
|
|
|
Observe, extract and remove registration and overlay response errors with greater clarity than ever before!
|
|
Modeled Field Magnification & Rotation after removal of process & stage errors.
|
|
Contour Plot of Y-Overlay Modeled Magnification, Rotation & Trapezoid
|
|
X & Y Registration Histogram
|
 Field Y-Overlay 3D Contour
|
|
Wafer & Field Modeled Errors
|
|
Coefficient response by family with Standard Error Uncertainty
|
|
X-Axis Registration ASML Metrology
|
|
DP and Feature Design splits by family
|
|
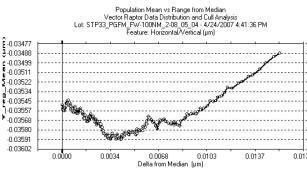
Feature Response from population median
|
|
X & Y Modeled Offset & Uncertainty across the slit
|
|
Modeled Process-induced Overlay Error
|


View PowerPoint of "VR Matching" (FOCAL data)
Advanced analysis and modeling of process overlay and registration data.
(Imports any metrology data)
A seventh-generation overlay & registration tool from TEA Systems with unique tools for Double Patterning and Feature Design Verification
An engineering workbench for setup, tuning, characterization and control.
Any Vector Raptor TM analysis can be encapsulated into macros &
production automated with trend charts using Weir DMA
-
Engineer’s Workbench or Production Automation
-
Analyses can be encapsulated into macros and production automated with trend charts using Weir DMA
-
-
Eliminate Double Patterning (DP) Error Sources
-
Reticle
-
Process error effects on Enhance Feature response
-
Scanner- to-pattern alignment
-
Registration mark-to-pattern alignment
-
Haze and lens contamination buildup
-
Individual Site Errors
-
Pattern registration drift
-
Target quality assessment
-
-
Process
-
Film Thickness nonuniformities
-
Edge and edge-bead influence
-
CD size vs Registration Correlation
-
-
Metrology Tool
-
Hard metrology errors
-
”Soft” errors from “near-miss” captures or process
-
Precision and covariance of variables
-
-
Exposure Tool
-
Wafer leveling and edge effects
-
Substrate film sensitivity
-
Grid stepping
-
IntraField and InterField variation
-
Lens-slit characterization
-
Reticle-scan range of variation
-
Reticle-scan path uniformity
-
Scan-direction sensitivity
-
-
New Approach to Overlay Analysis
Overlay and registration data analysis has been used extensively since the early 1980's when automated metrology was first introduced. There have been many overlay software packages provided over the years and every metrology tool and some exposure tools come with their own software. So why a new software package for overlay and registration analysis?
Quite recently classic overlay metrology methods based on automated optical microscopes have been joined by ellipsometer and scattering techniques that simultaneously measure both overlay and feature profile characteristics. Process control efforts therefore need a device-independent means of reading in data from any source to calibrate and understand the metrology response to subtle changes in test pattern design. New methods of comparison, correlation and calibration are also needed to tune these tools for process yield control.
Recent device-design nodes enjoyed the presence of process margins that had been improved to the point that most of the overlay error was within the capabilities of a properly tuned exposure tool ("Scanner"). However this safety margin was eliminated as recent radical changes in the approach to semiconductor manufacturing lithography were altered by a drastic change in direction of the technology roadmap into "Double Patterning".

"Double Patterning" (DP) is the selected method of extending the current proven "i193" technology to smaller feature sizes by splitting the most complex layers of new designs into two to five imaging levels. Each split level requires sequential exposure and development of different resist films and multiple etch steps to transfer the pattern-mask into the substrate. The intent of this technique is to allow the level of reticle enhancement to remain at present levels while continuing chip-design progress a few more nanometers (nm) down the design-node slope.
Classic overlay control techniques have been developed to optimize layer-to-layer pattern registration. Reticle manufacturing problems such as alignment-mark to device-pattern registration were easily controlled as a simple offset and rotation of the wafer exposure. Reticle-manufacturing process variations were acceptable as long as the feature size distribution feel within production tolerance. These levels of control are no longer sufficient for the needs of sub-45 nm designs.
The complexity of Double Patterning technology is raised by increased within-layer pattern-to-pattern registration demands to the mask-maker as well as the device manufacturer. The DP methodology presents a need for some very clever pattern-splitting algorithms in chip design to minimize the number of exposures required to piece together these critical layers. For the lithographer, these splits mean that the demands on process control will spiral upward with the additional need to control multiple reticle pattern shifts, rotation and even the effective critical feature size that are now occurring within a single lithographic device layer and will eventually still be subject to the same intra-layer requirements.
For the first time the overlay and even feature size uniformity of the most critical layers of the process will be registration and feature-size sensitive to whole-wafer process and exposure tool systematic drift whose errors are now derived from both reticle and wafer fabrication steps. Small changes in reticle alignment mark to pattern placement result not only in single-field registration errors but also in a reduction in feature size uniformity. Small variations in across-plate reticle process uniformity from etch or film variation compound to increase the across-field and across wafer uniformity of critical features and single-layer registration that in-turn complicates the overlay task of alignment to it's reference layer.
So with a device-layer now exposed by two to five reticles, how does the lithographer quantify and correct for errors created by the individual mask, wafer-process or exposure tool?
Vector Raptor provides the tools needed to extract the individual contributions of metrology, reticle, process and exposure tool. These new tools are enhanced by:
-
Tools for Double Patterning Lithography (DPL)
-
Standard models to meet any exposure-tool setup need
-
User-defined models that you can optimize to your studies
-
Breakout for comparison all raw data values and modeled control-surface elements by DPL pattern-split, wafer, focus, dose, NA, Sigma, scan direction etc.
-
Apply any models to wafer, field, scan-direction or lens-slit to determine the level of error contribution of each
-
Deconvolve the source of pattern misregistration to reticle design, reticle process, metrology, wafer process, scanner-stage, scanner alignment, scan direction, lens error or old-fashioned alignment error.
-
Load and compare ANY critical dimension (CD) or feature/film profile data to overlay or registration data to determine the level of Double Patterning error's contribution to feature-size errors.
-
-
advances in modeling methods
-
improve precision and accuracy,
- industry-standard models are provided for all exposure tools
-
user-defined models with the unique VR Model Editor
-
model application to derive scanner stepping-grid or process induced errors.
-
model fitting to fulfill the classic full-field alignment requirements as well as reticle-scan and lens slit contributions
-
highly advanced tools that enable the lithography to model the above sensitivities to variations in exposure-dose and defocus.
-
-
an object-oriented approach to data organization
-
allows drill-down examination of graphics with direct linkage to the data,
-
-
automated precision analysis
- extracts performance issues
between metrology, reticle and exposure-tool contributed errors such
as stage-stepping, reticle travel, scan-direction and lens-slit
aberrations

- extracts performance issues
between metrology, reticle and exposure-tool contributed errors such
as stage-stepping, reticle travel, scan-direction and lens-slit
aberrations
- simulation of individual error-source contribution
- correction improvement based upon measured and modeled performance.
- automated correlation between metrology variable response and feature-design
- data culling supported by multiple levels of interactive and automated techniques to improve calculation precision
- easy incorporation of focus and exposure-dose response through the use of the interactive graphic interface, a library of user-defined layout templates or direct data acquisition from the metrology (when provided).
- System and dataset matching utilities using VR Matching
- User-customized models
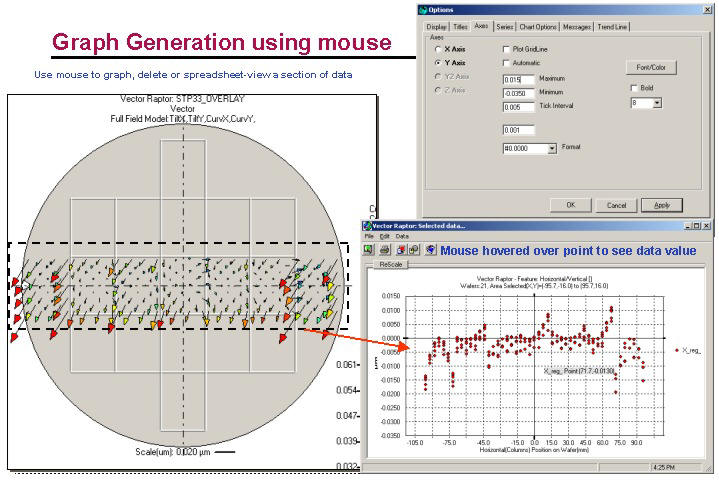
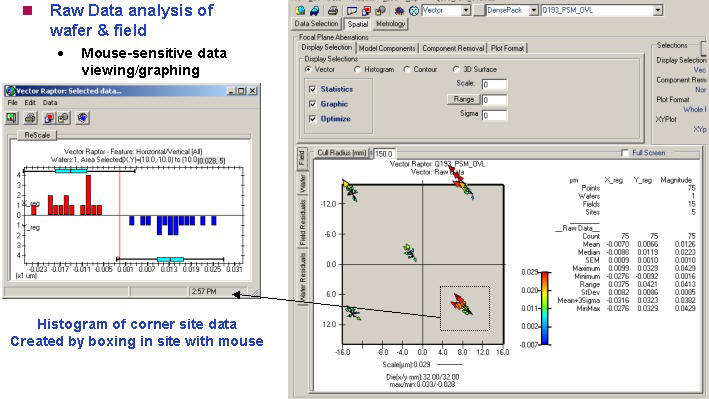
- Drill-down, interactive graphics and data
- Mouse-generated graphics and viewing of any data subset
- Any size data set up to
65,536 data points

- Precision calculation
- Covariance calculation
- Radial wafer dependency analysis
- Process, grid, lens and slit/scan extraction
- Five (5) levels of manual & automated data culling
- Multi-layer, Multi-variable lot analysis
- Advanced adaptive control surface modeling
- "What-if" simulation performance analysis
- User modified or custom-created models (Right graphic)
- Model application to grid v. wafer performance
- Model application to full-field, slit and scan performance
- Multi-Pattern comparative performance matching using "Feature Families"
- Remote program calling and analysis automation using Weir DMA
Vector Raptor loads data from Weir Standard Format storage that uses Microsoft Excel © workbooks. After the first import, this workbook is retained and loaded directly into the software from this user-friendly format. All data, analysis reports and Vector-Raptor derived response data sets are always available and open to the user. Weir workbook entered data and reports are summarized in a hyper-linked "Index" for rapid access and can be saved to any html-format site.
Data from ANY metrology tool is easily imported into the Weir Workbook for analysis. There is never a charge for updates or additions to the metrology library as long as the data is a standard metrology format or is intensively used by the customer.
- Weir Standard Data Format
workbooks
- Import into workbooks from ANY registration or overlay metrology
- ASML overlay, registration and FOCAL data
- Drag & drop file loading
- Open, documented data and report formats
- Microsoft Excel TM Spreadsheets and workbooks
- HTML Reports; many reports are generated and stored in the data's Weir Workbook. Reports and graphics can be saved into HTML format for display on any web site.
- Open system; access to all raw, calculated and modeled data.
-
Reticle & Photomask
-
Process Control and control-surface mapping
-
Data encapsulation for registration signature transmission to the wafer fab
-
New design qualification
-
Process uniformity control
-
In-wafer-process reticle validation
-
-
Simulation Support
-
Results feedback and verification
-
Profile validation and optimization
-
Process tolerance derivation for Design for Manufacture
-
Lot, wafer, reticle, field, lens and scan signature derivation
-
Feature response confirmation
-
-
Characterization & Optimization
-
Focus and dose signature reponse mapping
-
Reticle stage-direction sensitivity mapping
-
Reticle bow mapping
-
Reticle feature derivation from wafers images
-
Lens and scan-stage setup
-
Matching
-
Pattern performance characterization for design and Double Patterning applications.
-
-
Setup
-
Exposure tool stage, wafer-leveling, scan direction, lens slit performance on profiles,
-
Pre-lot exposure setup
-
Reticle and wafer signature removal for improved tool characterization
-
-
Film-control and feature design
-
automated error-budget and precision calculation.
-
exposure uniformity and spatial characterization.
-
wafer, field, slit, scan and site perturbation analyses.
-
model and simulations for “what-if” scenario queries during tool tuning sequence.
-
2D and 3D control surface mapping.
-
optional removal of selected modeled, raw and reticle errors before analysis.
-
-
Exposure Tool and Metrology
-
characterization and critical setup
-
error-budget and electro-mechanical precision module.
-
performance models and variable covariance mapping.
-
-
Yield Control
-
APC Modeling Engine using Weir DMA scripting
-
Reticle performance evaluation
-
Reticle Enhancement Technique (RET) optimization
-
Simulation of full-process contribution and corrections
-
Exposure; source and uniformity mapping
-
Film uniformity mapping
-
Performance and process daily monitor
-
Vector Raptor automatically imports and formats data from SEM’s, scatterometry, simulations, ELM, Optical and any tool measuring registration or overlay. Automated and manual mouse- interactive data culling methods are employed. Software can be used as an Advanced Process Control (APC) or tool tuning module. Output can be paper or binary media with control element output to optimize tool settings.
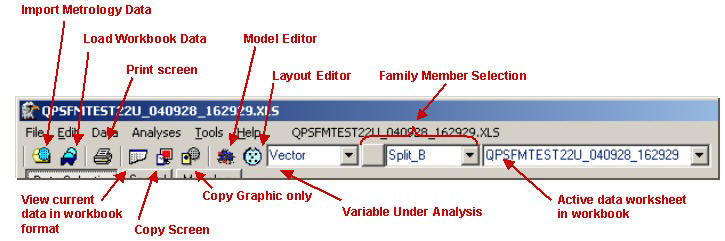
Data import is set up using a simple windows-graphic controls. The system
is an “open” tool with data stored and easily accessed using Microsoft
Excel Spreadsheets. Worksheet macros are not used but can be user-added if
desired.
Computer System Recommendations
TEA Systems Vector Raptor TM is a compiled application with a full object oriented, mouse-interactive interface. Drill down graphics and spreadsheet analysis supported. Functional on Windows 2000, XP etc.. Microsoft Excel© is required.
-
Pentium IV,1.2 GHz, or similar
-
256 Meg of RAM,
-
1024x768 Graphic Monitor and 30 M free space on disk for programs.
-
Data storage may require up to 6.0 Gigabytes additional.
Data subset viewing and graphic generation selected by the mouse.
ASML and FOCAL are trademarks of ASM Lithography.
ã Copyright 2007 TEA Systems Corporation 65 Schlossburg St., Alburtis, PA 18011 All rights reserved. Legal